
True Life: I'm a Fieldwork Fanatic
- Liah McPherson

- Jun 10, 2021
- 5 min read
Updated: Jun 10, 2021
Written by Liah McPherson
Well, the first semester of my master’s degree was fairly routine: taking classes, reading papers, and getting together all the bits and pieces necessary to begin my research in January. But less than a week into 2021, I was out on the water, bouncing around in an XL north swell, trying to find spinner dolphins during my first winter field effort. Since then, I’ve been to Maui (twice) to help Martin out with his PhD work on humpback whales (and learn a lot about flying big drones over marine mammals) and completed an entire second field season in April. To learn about the aims and methods for my master's thesis, check out the video I made about my fieldwork in April for the 2021 UH Mānoa Tester Symposium:
Dolphin Data: Studying Hawaiian Spinner Dolphins Off the Waiʻanae Coast
JANUARY:
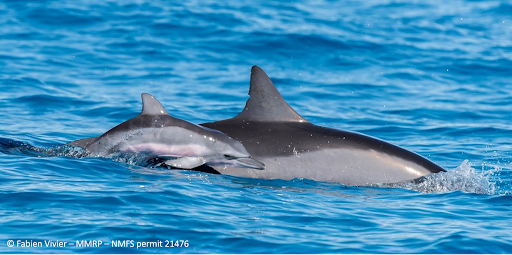
For my master's thesis, I am collaborating with NOAA Pacific Islands Fisheries Science Center to estimate the abundance and age structure of the spinner dolphins offshore West Oʻahu by conducting boat based photo-identification surveys up and down the Waiʻanae coast . January was all about getting the kinks out: learning the coastline, nailing down the ideal survey route, and getting a feel for our new research vessel, the Sedna. My surveys depart from Ko Olina Marina, which has graciously supported my fieldwork by offering me a boat slip during my field seasons. We figured out that surveying the coastline along two parallel tracks was the best way to cover the field site efficiently and thoroughly (Fig 1A). The tracks are 250m and 750m from shore, so assuming observers can sight dolphins up to 500m from the boat, this route allows us to survey the water for spinner dolphins out to 1km from the coast.


Fig 1. A) Parallel survey tracks at 250m and 750m from the coastline. B) Locations and group sizes of spinner dolphin sightings during the 2021 winter field season.
We went out on the water for a total of 12 days and encountered 14 groups of spinner dolphins (Fig 1B). Due to rough weather (think 10-14 ft swell, cranking wind and historic flash flooding) we had to spread those 12 days out over a 23-day period, and on all but two of those days, we were only able to survey half the coastline. However, we collected over 7000 dorsal fin images of Hawaiian spinner dolphins –– more than enough to begin building a catalog of distinct individuals.
Ahhhh, the joys of fieldwork!
FEBRUARY – MARCH:
Four days after the conclusion of my winter field season, I flew to Maui to help Martin with his PhD fieldwork and get more practice flying DJI Inspire 2 drones. What was supposed to be two weeks turned into the better part of two months. Each day, we went out on the water to search for humpback whales off West Maui. And during peak whale season, it didn’t take much searching – over 10,000 humpback whales migrate to the waters around Maui every year! The TLDR for Martin’s project is to measure the body condition of these whales via drone photogrammetry at different stages of the year, and at both ends of their migration route (Maui and Alaska) to shed light on the bioenergetic cost of being a humpback whale throughout its lifetime. It was incredible to participate in this research, work with these amazing whales, and become more confident in my drone-flying skills. Before coming to the University of Hawaii last August, I had been flying DJI Mavic Pros to study Atlantic spotted dolphins. But the Inspire 2 is a bit of a different beast… landing it into someone’s hands on a boat in the wind with a cross swell is tricky! Luckily, Martin and the rest of the team were only encouraging, and I got the hang of it. I flew back to Oʻahu on March 31st and went into action mode with only one week to prep before the start of my spring spinner dolphin fieldwork season.

A mother humpback whale and her calf off the coast of West Maui.
APRIL:
Compared to the troubles and toils of January, this year’s spring field season was a dream. Thanks to the support of Kim Antonio and the Hawaiian Princess at Mākaha, I was able to stay close to the marina for two weeks in April, allowing me to safely manage and transport all the fieldwork gear to and from the boat each day. Including the Inspire 2 drone! With the help of my labmates, my four great interns, and HIMB captains Fritz and Jules, I was able to consolidate my fieldwork into six days and survey the entire coast on each day (ideal!). We found a whopping 19 groups of spinner dolphins over those six days (Fig 2A). Applying the skills I learned in Maui to my own fieldwork, I was able to fly the Inspire 2 over groups of spinner dolphins to get better group size estimates and collect footage from which we will extrapolate the body length of individual dolphins (Fig 2B).


Fig 2. A) Locations and group sizes of spinner dolphin sightings during the 2021 spring field season. B) Video snapshot of Hawaiian spinner dolphins, taken from the Inspire 2.
WHATS NEXT:
My next field season begins in July. In the meantime, my interns and I have been hard at work processing data from the first two seasons –– narrowing down the usable dorsal fin images and uploading them to my Flukebook (© WildMe) account. Flukebook is a web-based software which uses computer vision algorithms to trace and match dorsal fin images for mark-recapture analysis (Fig 3B). This means that when the data from January and April are uploaded, we will be able to see which dolphins were sighted in both field seasons and use the proportion of resighted animals to begin estimating abundance.


Fig 2. A) Photographing Hawaiian spinner dolphin dorsal fins at Yokohama Bay. B) Dorsal fin tracing by a computer algorithm in Flukebook.
After the July field season, I’ll really be able to get into the meat of the analysis for this project. This organization of my fieldwork and analysis follows the Pollock’s Robust Design, and is of the most comprehensive ways to estimate population parameters for marine mammals (Fig 4 – read the caption if you dare). In total, I will have eight field seasons (also called “primary periods”) spaced seasonally in 2021 and 2022, within which I’ll survey the Waiʻanae coast six times (each survey is called a “secondary period”). Spacing out the field seasons by a few months gives dolphins the chance to move around and emigrate –– they can leave or return to the field site between my survey efforts. During any given field season, the population is assumed to be stable, with no changes to the population. This means that I’ll not only be able to calculate population abundance based on resightings of individuals, but I’ll also be able to estimate the survival and temporary emigration rates of this population. You can see why it’s called the Robust Design!

Fig 4. A visualization of my field seasons following Pollock’s Robust Design. The number of animals available in the study site and the capture and re-capture probabilities (𝑝) for each secondary sampling period are estimated for each primary sampling period. Between primary periods, apparent survival (𝜑) and two emigration parameters, (𝑦′′) and (𝑦′), are estimated, where (𝑦′′) is the probability that an individual is a temporary emigrant given that it was present in the study area during the previous sampling period, and (𝑦′) is the probability that an individual is a temporary emigrant given that it was not present in the study area during the previous sampling period. Over the course of this two-year study, 48 secondary sampling periods will be conducted within eight seasonal primary periods.
Okay, that's it for now. Back to photo processing and fieldwork prep.


Your description of the winter field effort in the XL north swell really captures the thrill of marine research. It makes me think about how an ai music extender could generate a perfect audio backdrop for such intense fieldwork experiences.
Interesting perspective. I’ve tried a few TTS tools recently, and anyspeech stands out for its voice quality.
This is a good place to read. I'm amazed at how much work you put into making such a great website with so much useful information. Enjoy the game and try to calm down: tiny fishing
Great read! It reminds me of tools like astrocartography where you can map your birth chart across different locations.
Not gonna lie, I didn’t expect much at first, but eggy car free turned out to be one of those “just one more try” type of games. The balance mechanic is trickier than it seems.